|
Respiratory Infections Dashboard
Respiratory Infections Data
Explore the latest data on respiratory infections across the County of Haliburton, the City of Kawartha Lakes, Northumberland County, and the City and County of Peterborough.
View weekly trends in emergency department visits, hospitalizations, and outbreaks, and track positivity rates for COVID-19, influenza, and RSV to support data-driven decisions for community health and well-being.
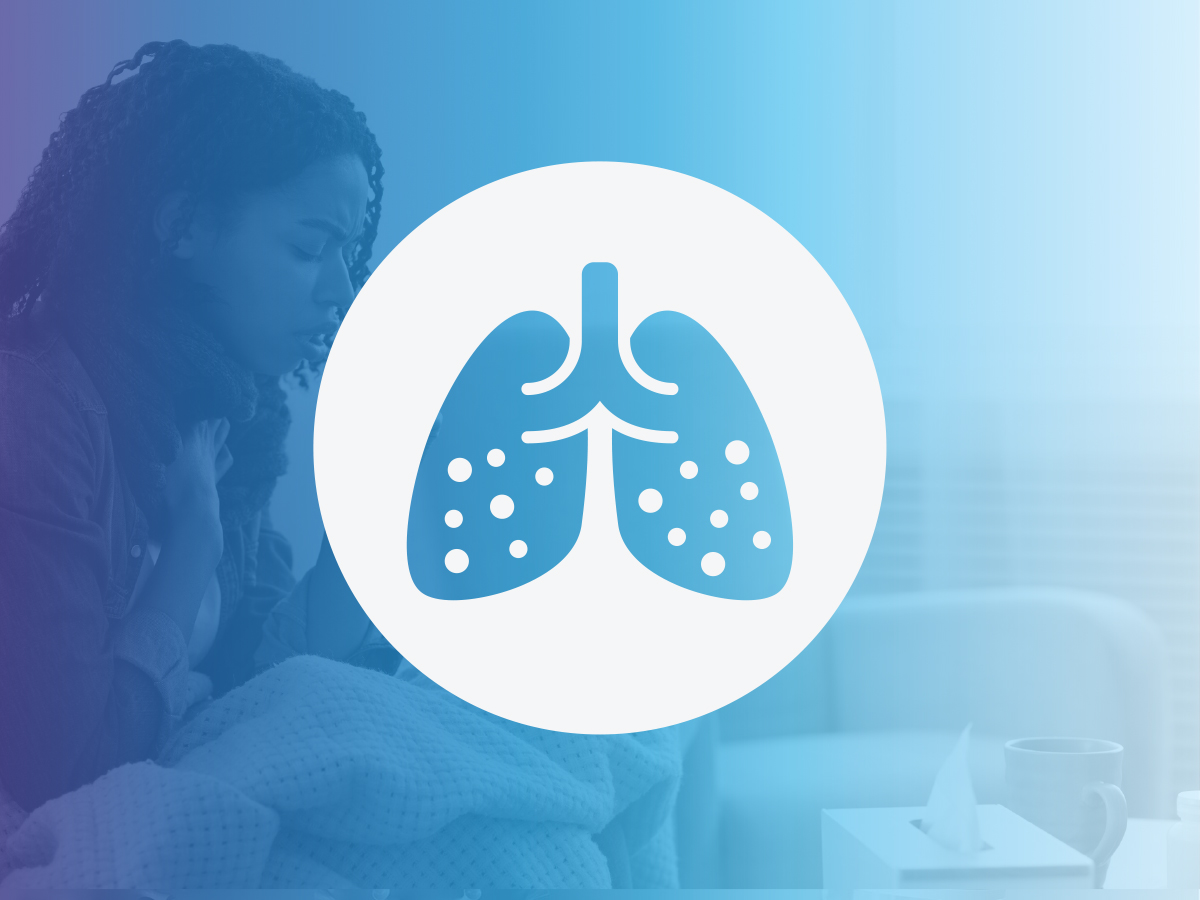
Respiratory Activity Level
The weekly respiratory activity level, is updated for the week of March 1st, 2026, and shows the current activity of respiratory illnesses across the Lakelands Public Health region, which includes the County of Haliburton, the City of Kawartha Lakes, Northumberland County, and the City and County of Peterborough.
To view activity levels for each specific area, visit the full Respiratory Infections Dashboard for detailed data.
|
Overall Respiratory Virus Activity is MODERATE |
Respiratory Activity Level Recommendations
The guide provides actions to help reduce the spread of illnesses such as COVID-19, influenza, and RSV. Using local data, it recommends steps like staying up to date with vaccinations, practicing good hand hygiene, wearing masks when needed, and staying home when sick to protect both individual and community health.
|
|
Tips to Protect Yourself and Others from Respiratory Illness
- Clean your hands frequently with alcohol-based hand sanitizer or soap and water.
- Cover your coughs and sneezes with a tissue or your sleeve. Dispose of the tissue and clean your hands.
- Keep space between yourself and others, when possible, to help reduce the spread of illness.
- Spend time outdoors or in well-ventilated indoor spaces
- Ensure your ventilation system is in good working order.
- If you don’t have a ventilation system, open windows to increase fresh air flow, if possible.
- When possible, reduce time spent in indoor crowded spaces, especially if poorly ventilated.
- Stay home when you are sick. For example, if you have a fever, new or increased cough, or vomiting and/or diarrhea.
- Being vaccinated against COVID-19 and influenza helps to protect you from severe disease, including hospitalization and death.
- Remember to get all vaccines that are recommended based on your age and health status, which may include vaccines for influenza, COVID-19 and respiratory syncytial virus (RSV).
Additional Considerations
- Be up to date with your COVID-19 and influenza (flu) vaccines.
- Wear a mask when the risk level is elevated. Tightly and properly fitted masks (e.g., N95/ KN95) are recommended.
- Stay home when you are sick!
- Monitor for symptoms and seek testing/treatment as you are eligible.
- Proper hand washing and cough etiquette are suggested for preventing the spread of multiple types of infections.
- Are you able to open windows and doors to improve ventilation?
- Are others you are gathering with, at an increased risk for getting COVID-19? Would virtual or smaller gatherings be safer?
- Is there another time, when it is less busy, that you can be in a space?
- Is everyone that will be in a space, up to date with their COVID-19 and influenza (flu) vaccines?
- Please speak with your health care provider if you have questions about your personal health.
About the Respiratory Infections Dashboard
The Respiratory Infections Dashboard offers weekly updates on local respiratory illness trends, including emergency department visits, hospitalizations, and outbreaks.
1. Click/select a report button located across the top of the dashboard to view different content.
2. Selected the desired filter from the corresponding drop-down list(s) to view specific or filtered data.
3. To see larger visuals:
Dashboards are best viewed on a desktop screen. Hover over the visual you want to enlarge. A small box will appear in the top right corner labeled 'Focus Mode'. Click on this box to enter full screen. To return, click the 'Back to Report' button at the top left.
3. To View Graphs in Table Format:
Right-click anywhere on the graph you are interested in and select 'Show as a Table'. To go back, click the 'Back to Report' button at the top left of the page.
4. Use Tooltips for More Information:
Hover over a visual to see additional information in a tooltip.
The data for this dashboard were sourced from the Acute Care Enhanced Surveillance (ACES) system, the integrated Public Health Information System (iPHIS), Public Health Ontario's (PHO) Ontario Respiratory Virus Tool (ORVT), and the Ontario Ministry of Health’s Capacity Planning and Analytics Division’s Visual Analytics COVID-19 Regional Hospital report.
Respiratory Virus Wastewater Surveillance
Please use the link to view the wastewater surveillance data updated January 7, 2026. Monitoring is now paused as we develop an updated approach for the Lakelands Public Health area, which includes the City of Kawartha Lakes, County of Haliburton, Northumberland County, and the City and County of Peterborough. Surveillance is set to resume in summer 2026.
If you have questions, please contact us.
Contact Our Team
We’re here to help. Reach out and we’ll respond as quickly as possible.