

Food Insecurity Dashboard

Food Insecurity Dashboard

Explore the rate of food insecurity in the Lakelands Public Health area over a three-year period.  See the cost of a Nutritious Food Basket for a reference family of four in the Lakelands region.  Compare Ontario’s minimum wage with a living wage. Find out how much money families would have left over after paying for housing and food.


Use this information to stay informed and support data driven decision making for the well-being of those in the Lakelands Public Health region.

Food Insecurity Snapshot

22.3%

households are food insecure (2022-2024)

$22.20

Living wage (2025) 

$1,250

cost of a nutritious food basket for a reference family of four in 2025

9

income household scenarios

Food Insecurity is a Serious Issue

Food insecurity is a serious public health problem in Ontario, and across Canada. Learn more about the health impacts and how you can make a difference.

About the Food Insecurity Dashboard

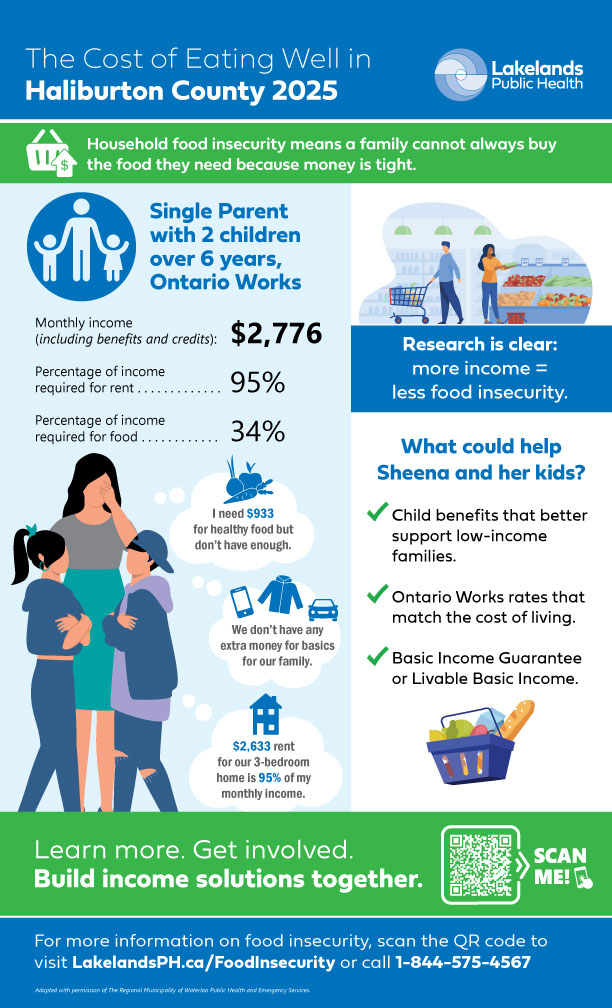
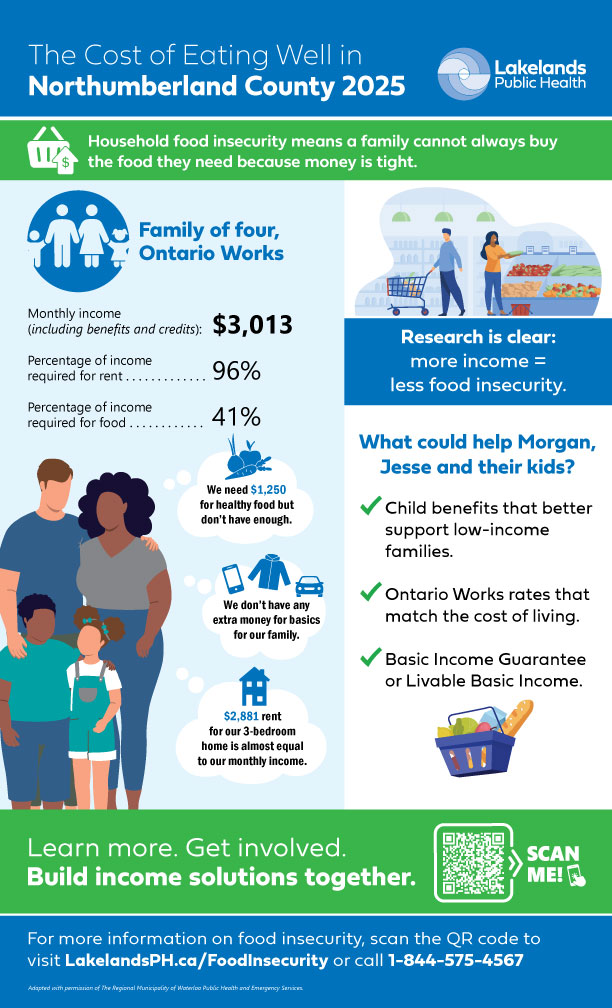
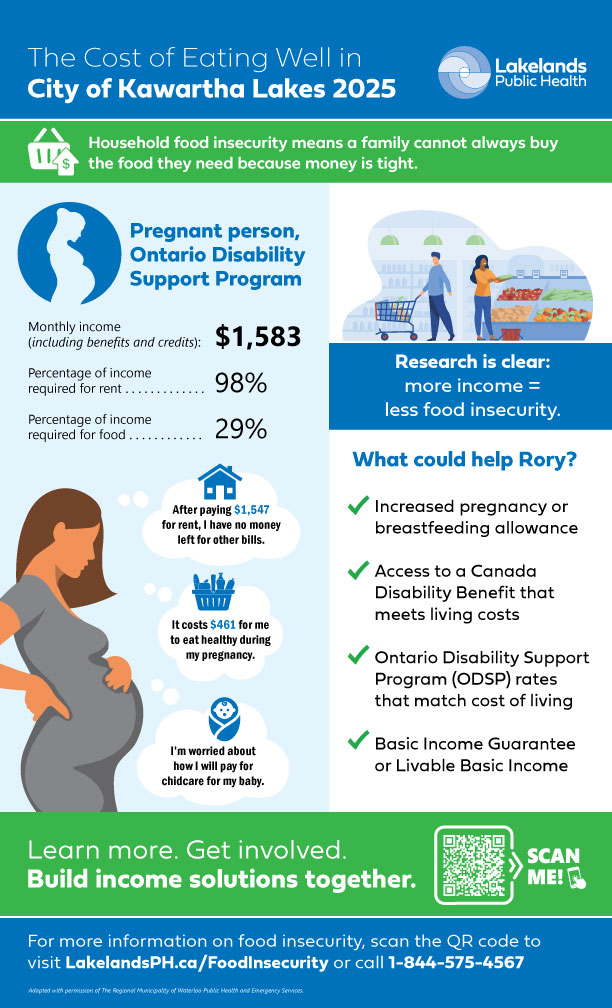
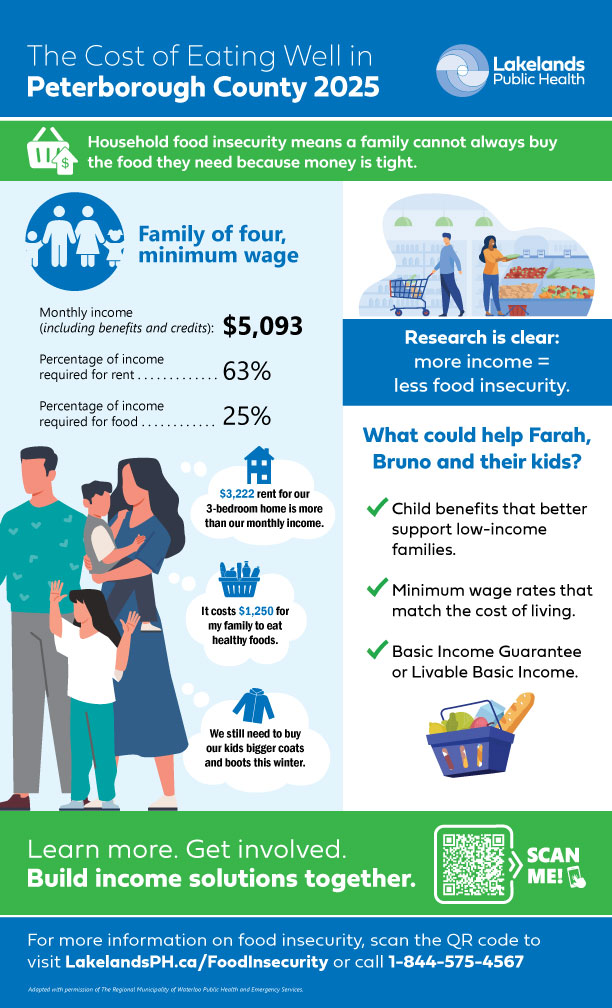
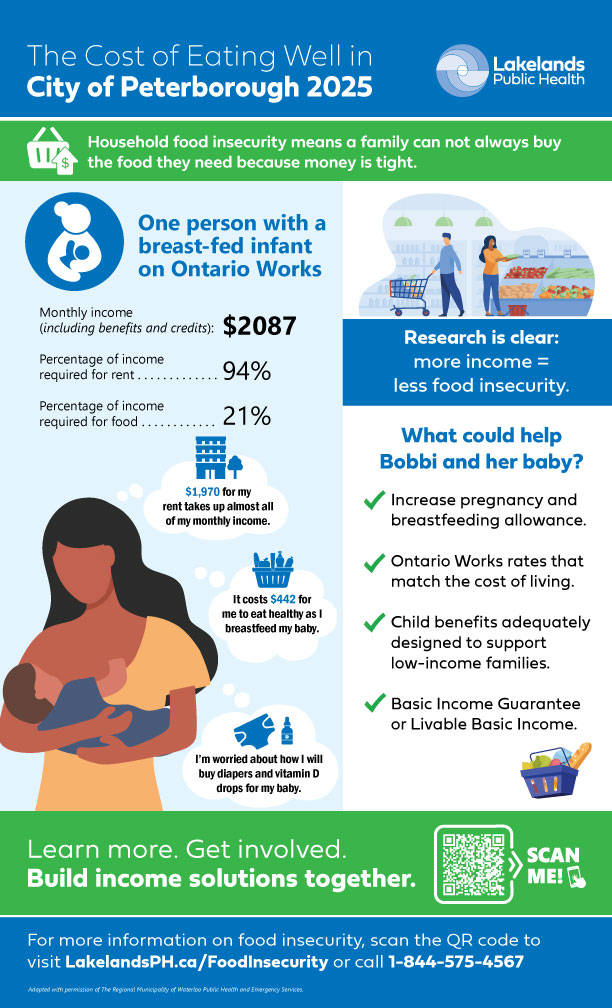
The food insecurity dashboard presents the rate of food insecurity in the Lakelands Public Health region (Haliburton County, City of Kawartha Lakes, Northumberland County, Peterborough County and the City of Peterborough) over a three-year period. The dashboard compares Ontario’s minimum wage with a living wage as well. Results of the 2025 Nutritious Food Basket are used in income scenarios captured in the dashboard. Income scenarios highlight how much money is leftover after a family pays for food and rent. The income scenarios also show the percentage of income required for food and rent.   

The Food Insecurity Dashboard is updated annually, when data is available.

1. Click/select a report button located across the top of the dashboard to view different content. 

2. Selected the desired filter from the corresponding drop-down list(s) to view specific or filtered data. 

3. To see larger visuals: 

Dashboards are best viewed on a desktop screen. Hover over the visual you want to enlarge. A small box will appear in the top right corner labeled 'Focus Mode'. Click on this box to enter full screen. To return, click the 'Back to Report' button at the top left. 

3. To View Graphs in Table Format: 

Right-click anywhere on the graph you are interested in and select 'Show as a Table'. To go back, click the 'Back to Report' button at the top left of the page. 

4. Use Tooltips for More Information: 

Hover over a visual to see additional information in a tooltip. 

Average monthly rent – Rural Housing Information System (RHIS). Housing Market, Average Asking Rent (County of Haliburton, City of Kawartha Lakes, Northumberland County; Oct 2023 - Sep 2024) [cited 2024 Sep 19]. 

Cost of a Nutritious Food Basket – Nutritious Food Basket data (2024). Haliburton, Kawartha, Pine Ridge District Health Unit. 

Household Food Insecurity – Ontario Agency for Health Protection and Promotion (Public Health Ontario). Technical notes: household food insecurity snapshot [Internet]. Toronto, ON: King’s Printer for Ontario; c2024 [modified 2024 Jul 5; cited 2024 Aug 25]. Available from: https://www.publichealthontario.ca/en/Data-and-Analysis/Health-Equity/Household-Food-Insecurity; Original data source: Statistics Canada, Centre for Income and Socioeconomic Well-being Statistics, Canadian Income Survey, 2018 - 2022. 

Income scenarios – Disseminated by the Ontario Dietitians in Public Health Food Insecurity Workgroup, in partnership with WoodGreen Community Services. 

Living wage – Ontario Living Wage Network. c2024 [modified 2024 Sep 27; cited 2024 Oct 31]. Rates - Ontario Living Wage Network.  Available from:  https://www.ontariolivingwage.ca/rates  

Minimum wage – Government of Ontario, Ministry of Labour, Immigration, Training, and Skills Development. Minimum wage rates [Internet]. Toronto, ON: King’s Printer for Ontario; c2024 [modified 2024 Sep 27; cited 2024 Oct 31]. Available from: https://www.ontario.ca/document/your-guide-employment-standards-act-0/minimum-wage. 

Contact Our Team

We’re here to help. Reach out and we’ll respond as quickly as possible.